Liquid-Level Control and Delivery System Uses a Compensated Silicon Pressure Sensor and Precision Delta-Sigma ADCs, Part 2
Introduction
This reference design describes a noncontact measurement approach for the measurement and distribution of most industrial liquids, utilizing a data acquisition system (DAS) along with a compensated silicon pressure sensor and a high-precision delta-sigma analog-to-digital converter (ADC). This document is useful for those designing a wide variety of precision-sensing and portable applications that must measure and distribute industrial liquids.
This reference design is the second in a series on compensated silicon pressure sensor applications. The first, reference design 5319, “Liquid-Level Control and Delivery System Uses a Compensated Silicon Pressure Sensor and Precision Delta-Sigma ADC, Part 1,” describes the history of measuring pressure, the modern silicon pressure sensor, and the low-cost solution of temperature-compensated pressure sensors. (The popular and cost-effective MPX2010 series silicon piezoresistive pressure sensor from Freescale® Semiconductor provides temperature compensation in the range of 0°C to +85°C, and is featured in this design.) Part 1 explains how these processors can be improved with delta-sigma ADCs before launching into a case study about the use of a modern pressure sensor and a delta-sigma ADC to measure water level.
In this document, Part 2, the system described in Part 1 is used in a noncontact measurement approach for the measurement and distribution of most industrial liquids. Here we discuss ways to resolve high-current solenoid valve and pump controls without jeopardizing the high-accuracy delta-sigma ADC-based DAS. As in Part 1, this reference design suggests system algorithms, analyzes noise, and offers calibration ideas for improving system performance while reducing complexity and cost.
详情介绍
Introduction
This reference design describes a noncontact measurement approach for the measurement and distribution of most industrial liquids, utilizing a data acquisition system (DAS) along with a compensated silicon pressure sensor and a high-precision delta-sigma analog-to-digital converter (ADC). This document is useful for those designing a wide variety of precision-sensing and portable applications that must measure and distribute industrial liquids.
This reference design is the second in a series on compensated silicon pressure sensor applications. The first, reference design 5319, “Liquid-Level Control and Delivery System Uses a Compensated Silicon Pressure Sensor and Precision Delta-Sigma ADC, Part 1,” describes the history of measuring pressure, the modern silicon pressure sensor, and the low-cost solution of temperature-compensated pressure sensors. (The popular and cost-effective MPX2010 series silicon piezoresistive pressure sensor from Freescale® Semiconductor provides temperature compensation in the range of 0°C to +85°C, and is featured in this design.) Part 1 explains how these processors can be improved with delta-sigma ADCs before launching into a case study about the use of a modern pressure sensor and a delta-sigma ADC to measure water level.
In this document, Part 2, the system described in Part 1 is used in a noncontact measurement approach for the measurement and distribution of most industrial liquids. Here we discuss ways to resolve high-current solenoid valve and pump controls without jeopardizing the high-accuracy delta-sigma ADC-based DAS. As in Part 1, this reference design suggests system algorithms, analyzes noise, and offers calibration ideas for improving system performance while reducing complexity and cost.
System Design
A simplified diagram of the development system for this reference design is shown in Figure 1. This system features a controlled-liquid reservoir consisting of a vertical plastic water-filled tube with 100mL measurement marks on the side. The thin inner measurement tube is located inside the controlled reservoir, and connects directly to the sensor’s positive pressure port, while the reference pressure port is exposed to the atmospheric pressure.
A small DAS printed circuit board (PCB) directly attached to the pressure sensor provides dynamic control of liquid-level measurements. It generates control signals from the PC-based control and dispense GUI to activate the valve-driver PCB and pump-driver PCB, and then to deliver a prescribed volume of the liquid to the controlled vessel. The DAS also provides a control signal to the water pump.
The external, main liquid reservoir provides large storage capacity for the liquid needed to replenish the controlled-liquid reservoir. It ensures a steady pressure. The water pump turns on whenever the level at the controlled-liquid reservoir drops below a defined mark. This action maintains a constant liquid height in the controlled reservoir.
In this reference design, pressure applied to the sensor’s positive pressure port is transferred by air trapped in the measurement tube, thereby providing a barrier between the liquid in the reservoir and the sensor. This design makes it possible to use a cost-effective generic pressure sensor in industrial applications with chemically aggressive or corrosive liquids.
Basic System Operation
This system (Figure 1) measures volume by measuring the height of the liquid, which is itself determined by the pressure inside the sealed tube with liquid pushing the air inside it. As discussed in Part 1, the pressure is directly proportional to the height of liquid in the large container. The air is trapped inside the inner tube, thus causing the pressure to build there. The higher the liquid rises, the more the pressure builds.
The system produces a very good reading of the height of liquid present in the large vessel. With a fixed-diameter outer vessel, the total volume can be calculated by using a simple equation: π × radius × radius × H.
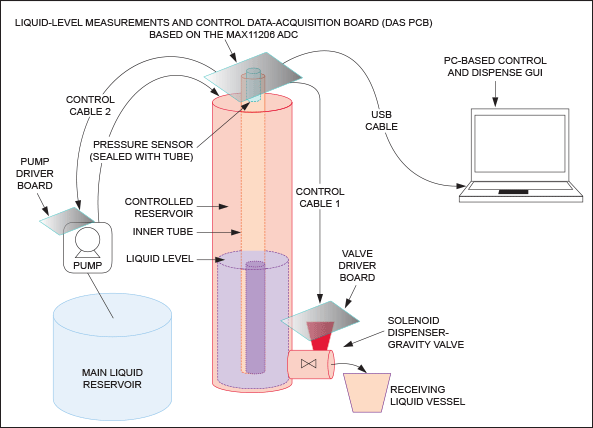
Figure 1. Hydrostatic pressure produced by the water column at the bottom of the controlled-liquid reservoir uses the trapped air in the measurement tube to produce the same amount of pressure on the sensor. At its output, the pressure sensor produces a pressure equivalent voltage that is measured and digitized by the MAX11206 ADC, processed by the integrated MAXQ622 microcontroller, and finally sent to a PC though the USB cable. The PC-based control and dispense GUI then sends a delivery request to the DAS which activates the valve-driver PCB to deliver a certain amount of the liquid predefined by the software. The DAS also provides control signals to the pump-driver PCB to turn on/off so a constant liquid height is maintained.
Precision and Resolution
For a system like this, we must account for the density of the liquid if we want to dispense by weight. In general, liquid density¹ varies with changes in temperature. For example, the density of water² increases between its melting point at 0°C and +4°C, reaching a standard value of 999.972 (practically 1000) kg/m³ at +4°C. At room temperature, +22°C, the density of water is 997.774kg/m³. All measurements in this article were done at room temperature around +22°C, ±3°C, where water density varies around ±0.1%. Note that this is below the targeted precision for the DAS referenced in this article. For a typical MPX2010 full-scale range of 10kPa, the water height equivalent is 1.022m. (See Part 1 of this article.)
We start by calculating the full-scale voltage swing that we see from the pressure sensor when the maximum pressure for this sensor, PFS - 10kPa, is applied. Note that 10kPa translates to a water height of 1 meter.
| VFS = VFST ± (VDD/VPST) | (Eq. 1) |
Where:
VFS is full-scale voltage swing when excited by VDD;
VPST is typical excitation voltage;
VFST is full-scale sensor voltage swing when excited by VPST;
VDD is excitation voltage.
Since we are exciting this pressure sensor with a VDD of 3.3V instead of the typical VPST of 10V, we only see a swing of VFS = 8.25mV instead of VFST = 25mV.
| VFS = 25mV ± (3.3/10) = 8.25mV (full-scale span at 3.3V) | (Eq. 2) |
From Equation 2 we know how much of the ADC’s range we require: 8.25mV to measure up to the 1000mm level of water. Note that in this setup the ADC does have a range of 3.3V. In fact, we are not using the full range of 1000mm for this sensor. We are only going to the height of 480mm, which translates to a pressure range of approximately half of maximum range of 10kPa. To keep it simple, we only multiply by 0.48 to obtain the new full-scale voltage swing.
The MAX11206 used in this design is a 20-bit delta-sigma ADC suitable for low-power applications that require a wide dynamic range. It has an extremely low input-referred RMS noise of 570nV at 10sps. We know that the noise-free resolution (NFR) is about 6.6 x RMS noise. In this case, NFR is 3.762µV. (This is also sometimes called the flicker-free code.) The noise-free codes present in the range can be found by dividing the ADC range used by the input-referred noise-free bits size:
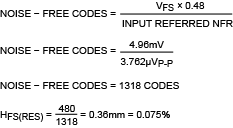
Where HFS is the measurement resolution of height.
The estimated full-scale resolution at ±0.075% is more than sufficient to achieve the DAS’s target precision of ±1% in this reference design. This proves that the ADC can directly interface with a new compensated silicon pressure sensor without additional instrumentation amplifiers.
Calibration and Calculation
In the current design example, liquid is located inside two concentric cylindrical walls. The dispensing volume can be calculated using a linear function based on two-point calibration, as shown in Figure 2.
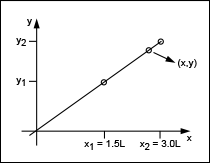
Figure 2. In this design example, the calibration procedure is based on the points selected at volumes x2 = 3L and x1 = 1.5L. This calibration range was chosen because the control system maintains a constant liquid height around x2 = 3L and the maximum single dispense is 1.5L. y2 and y1 represent corresponding ADC codes.
Based on two-point calibration and Figure 2, a linear function formula is defined in Equation 7:
| Δy = KCAL ± Δx | (Eq. 3) |
Where:
Δy - ADC is the code needed for dispensing Δx volume of liquid;
KCAL is the calibration coefficient calculated by Equation 8 (see Figure 2).
Therefore:
| KCAL = (y2 - y1)/(x2 - x1) | (Eq. 4) |
This calculation method works efficiently when two-point calibration is available; it makes volume distribution independent of the specific liquid density.
Electronic Design
Figure 3 is a simplified block diagram of the pressure-measurement and control DAS PCB.
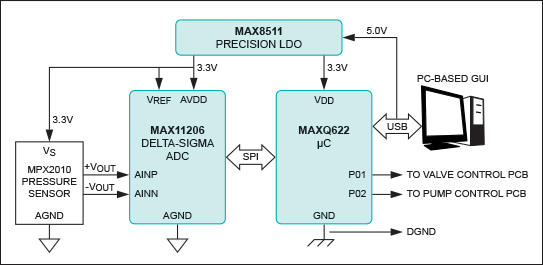
Figure 3. Diagram shows the implementation of the pressure-measurement and control DAS PCB with direct interface to the compensated silicon pressure sensor utilizing a ratiometric approach. This design allows use of the analog power supply as a reference. The DAS PCB also provides a USB-based interface with the PC-based control and dispense GUI software, and it generates control signals to the identical valve-drive PCB and pump-driver PCB. This approach produces a fully automated delivery system.
Figure 4 shows a schematic for the valve- and pump-driver PCBs.
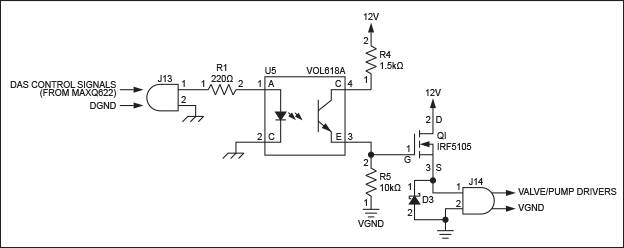
Figure 4. Schematic shows the implementation of the optically isolated driver PCB. Control signals from the DAS PCB are transferred to the driver PCB through a simple two-wire cable and applied directly to the optocoupler U5. The phototransistor output of U5 activates power MOSFET Q1 and provides the high-current drive needed to operate the valve or pump. Optocoupler U5 is the means for the cost-effective galvanic isolation for the DAS PCB’s high-accuracy control over any interference coming from the high-power driver PCBs.
Processing the Data
The firmware in the MAXQ622 microcontroller (Figure 3) provides data-reading capability to the software through USB. The GUI software manages the following major functions which are charted in Figure 5:
- Initializes the MAX11200 ADC
- Collects and processes the ADC's output data
- Calculates the code for the volume to be dispensed using Equations 3 and 4
During initialization, the MAX11200 ADC goes through the self-calibration process, enables the input signal buffers, and disables system gain calibration and system offset calibration. Selection of the sampling rate is very important for pressure measurement in industrial and medical applications. This DAS allows reasonably fast data acquisition with excellent (100dB or better) powerline 50Hz/60Hz rejection. The recommended external clock for 60Hz line-frequency rejection is 2.4576MHz, which is effective for data rates of 1sps, 2.5sps, 5sps, 10sps, and 15sps. For 50Hz line-frequency rejection, the recommended external clock is 2.048MHz, which is effective for data rates of 0.83sps, 2.08sps, 4.17sps, 8.33sps, and 12.5sps. Input signal buffers increase the input impedance to the high megohms range. This improves measurement precision because it practically eliminates the shunting effect of the input dynamic current.
The software implements algorithms based on Equations 3 and 4. Raw measurement data is processed inside the PC.
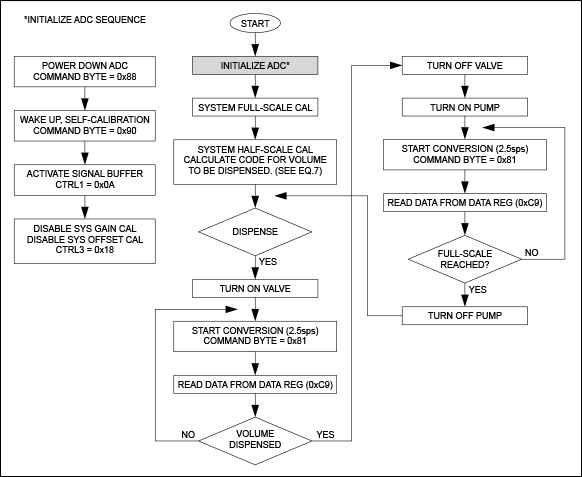
Figure 5. Chart outlines the top-level actions of the DAS firmware and software.
System Implementation
Figure 6 shows the implementation of the development system in Figure 1.
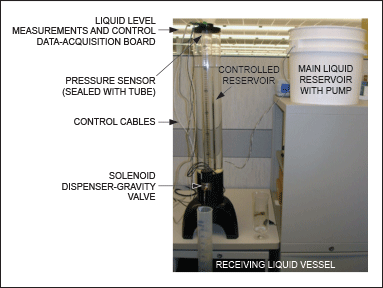
Figure 6. This system features a controlled-liquid reservoir equipped with 100mL measurement marks on the side of the tube. The thin measurement tube is located inside the main liquid reservoir and connects directly to the sensor’s positive pressure port. The control DAS PCB is attached directly to the pressure sensor and permits dynamic measurement of the liquid level. Control signals from the PC-based control and dispense GUI activate both the valve-driver PCB and the pump-driver PCB so they deliver a prescribed amount of the liquid to the receiving liquid vessel. The control and dispense GUI also provides a control signal to the water pump. The main liquid reservoir stores the liquid needed to replenish and maintain the controlled-liquid reservoir. The water pump turns on when the level in the controlled-liquid reservoir drops below three liters and, thus, maintains a constant liquid height of three liters.
To test the system, the calibrated receiving liquid vessel was filled repeatedly to the 500mL level with 1mL (0.2%) liquid.Table 1 lists the resulting output code measurements.
Table 1. Output Code Measurements for Receiving Liquid Vessel Filled to the 500mL Level
| Dispense Volume (mL) | Number of Readings | Code with Full Dispenser | Code After 500mL Dispensed | Difference (mL) |
|---|---|---|---|---|
| 500 | 1 | 545 | 443 | 102 |
| 500 | 2 | 545 | 443 | 102 |
| 500 | 3 | 545 | 443 | 102 |
| 500 | 4 | 545 | 443 | 102 |
| 500 | 5 | 545 | 443 | 102 |
Table 1 shows that this DAS liquid-level control and delivery system based on the MAX11206 ADC achieved better than ±1% precision for 500mL distribution.
Conclusion
New MEMS temperature-compensated silicon pressure sensors are dropping in price and package size. This makes them attractive for a wide variety of precision sensing and portable applications that must measure and distribute industrial liquids using a noncontact measurement approach. These applications require a low-noise delta-sigma ADC such as the MAX11206 to directly interface to PCB-mounted silicon pressure sensors. With simple compensation schemes, this approach easily increases the absolute accuracy of these pressure sensors.
In this reference design, the MAX11206 directly interfaces with new silicon pressure sensors such as the MPXM2010 without needing additional instrumentation amplifiers or dedicated current sources. Thermal errors are reduced, and this allows designers to implement simple linear algorithms, which reduce system complexity and cost. The silicon pressure sensors and the ADC create a high-performance, cost-effective, low-power liquid-level control and delivery system, which is excellent for precision sensing and portable applications.
References
- For a basic discussion of density, see http://en.wikipedia.org/wiki/Density.
- For a basic discussion of water, see http://en.wikipedia.org/wiki/Water.
Further Reading
Application note 871, “Demystifying Piezoresistive Pressure Sensors.”
Application note 840, “MAX1455 Diagnostic Clip Boost Circuit.”
Application note 3775, “Design Considerations for a Low-Cost Sensor and A/D Interface.”
Application note 5319, “Liquid-Level Measurement System Uses a Compensated Pressure Sensor and Precision Delta-Sigma ADCs, Part 1.”
Freescale Semiconductor,“10 kPa On-Chip Temperature Compensated and Calibrated Silicon Pressure Sensors” (PDF).
µMAX is a registered trademark of Maxim Integrated Products, Inc.
![]() Freescale is a registered trademark and registered service mark of Freescale Semiconductor, Inc.
Freescale is a registered trademark and registered service mark of Freescale Semiconductor, Inc.
![]() MAXQ is a registered trademark of Maxim Integrated Products, Inc.
MAXQ is a registered trademark of Maxim Integrated Products, Inc.
![]() OMRON is a registered trademark of OMRON Corporation.
OMRON is a registered trademark of OMRON Corporation.
![]()
